

Website, server, SSL and domain monitoring in one place
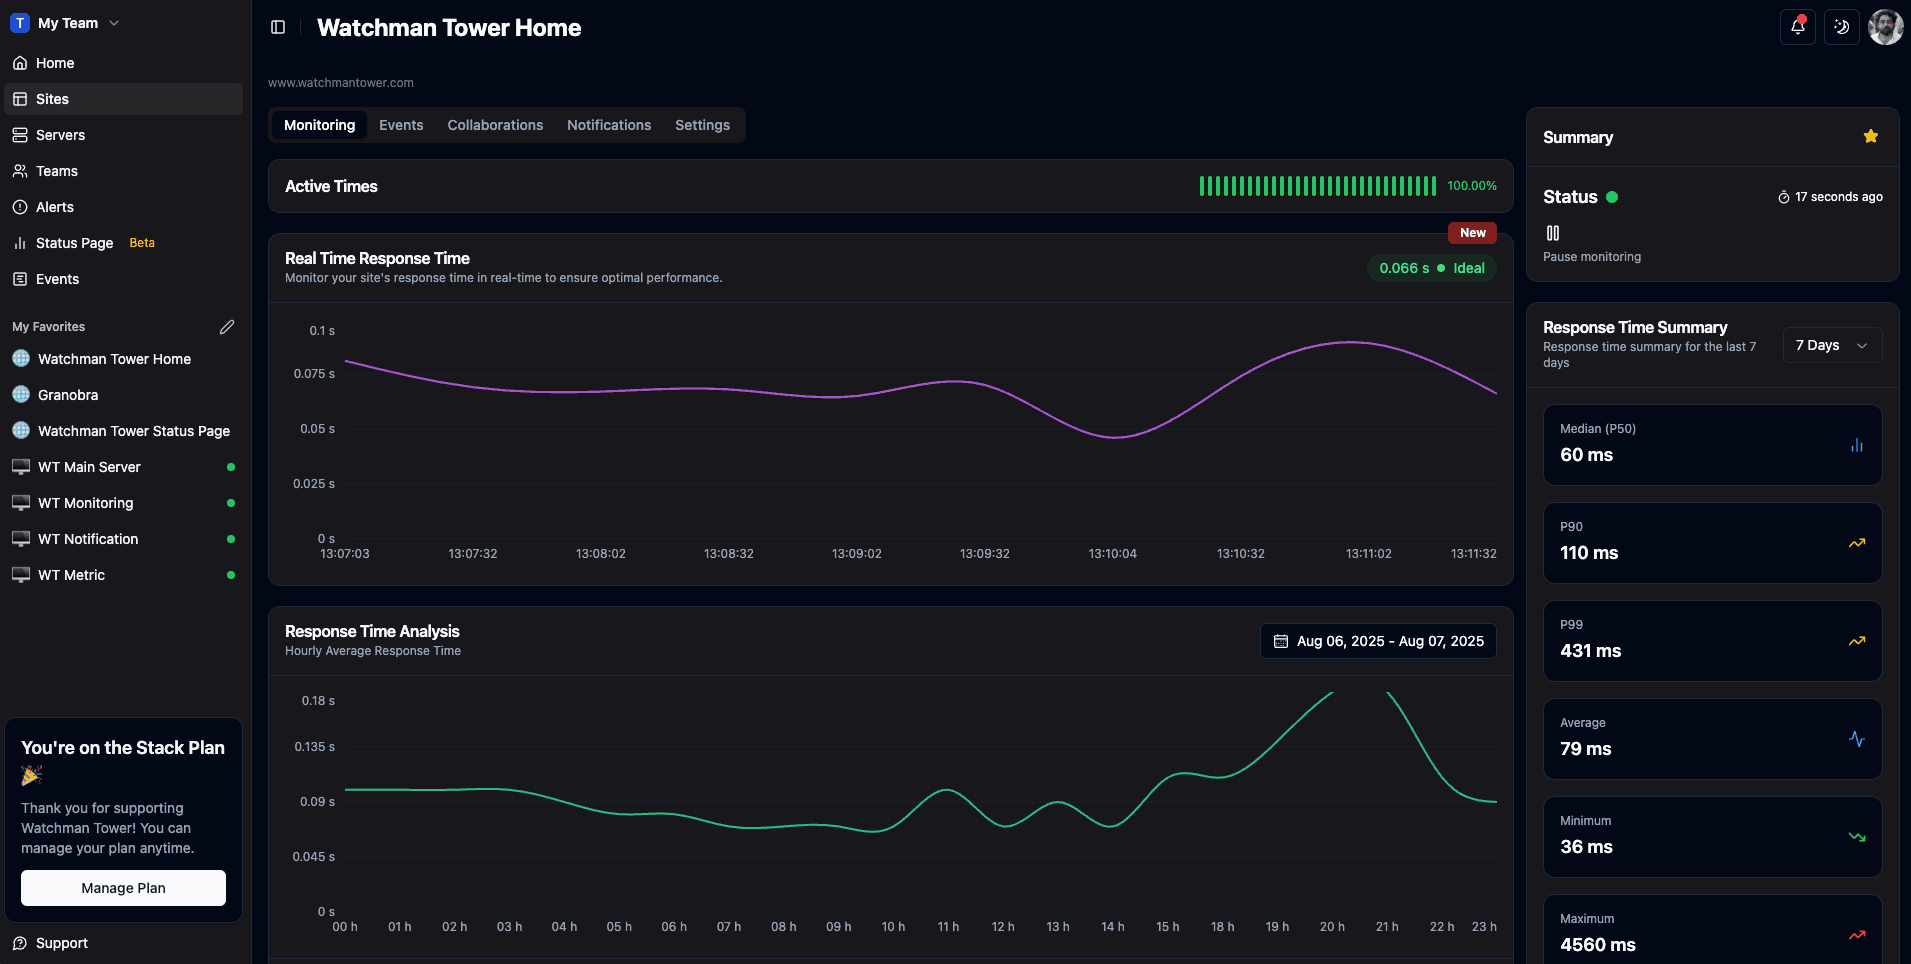
Every site is checked from 3 regions. Noema, the health engine behind Watchman Tower, confirms a problem before you are alerted, so you hear about real incidents and not network noise.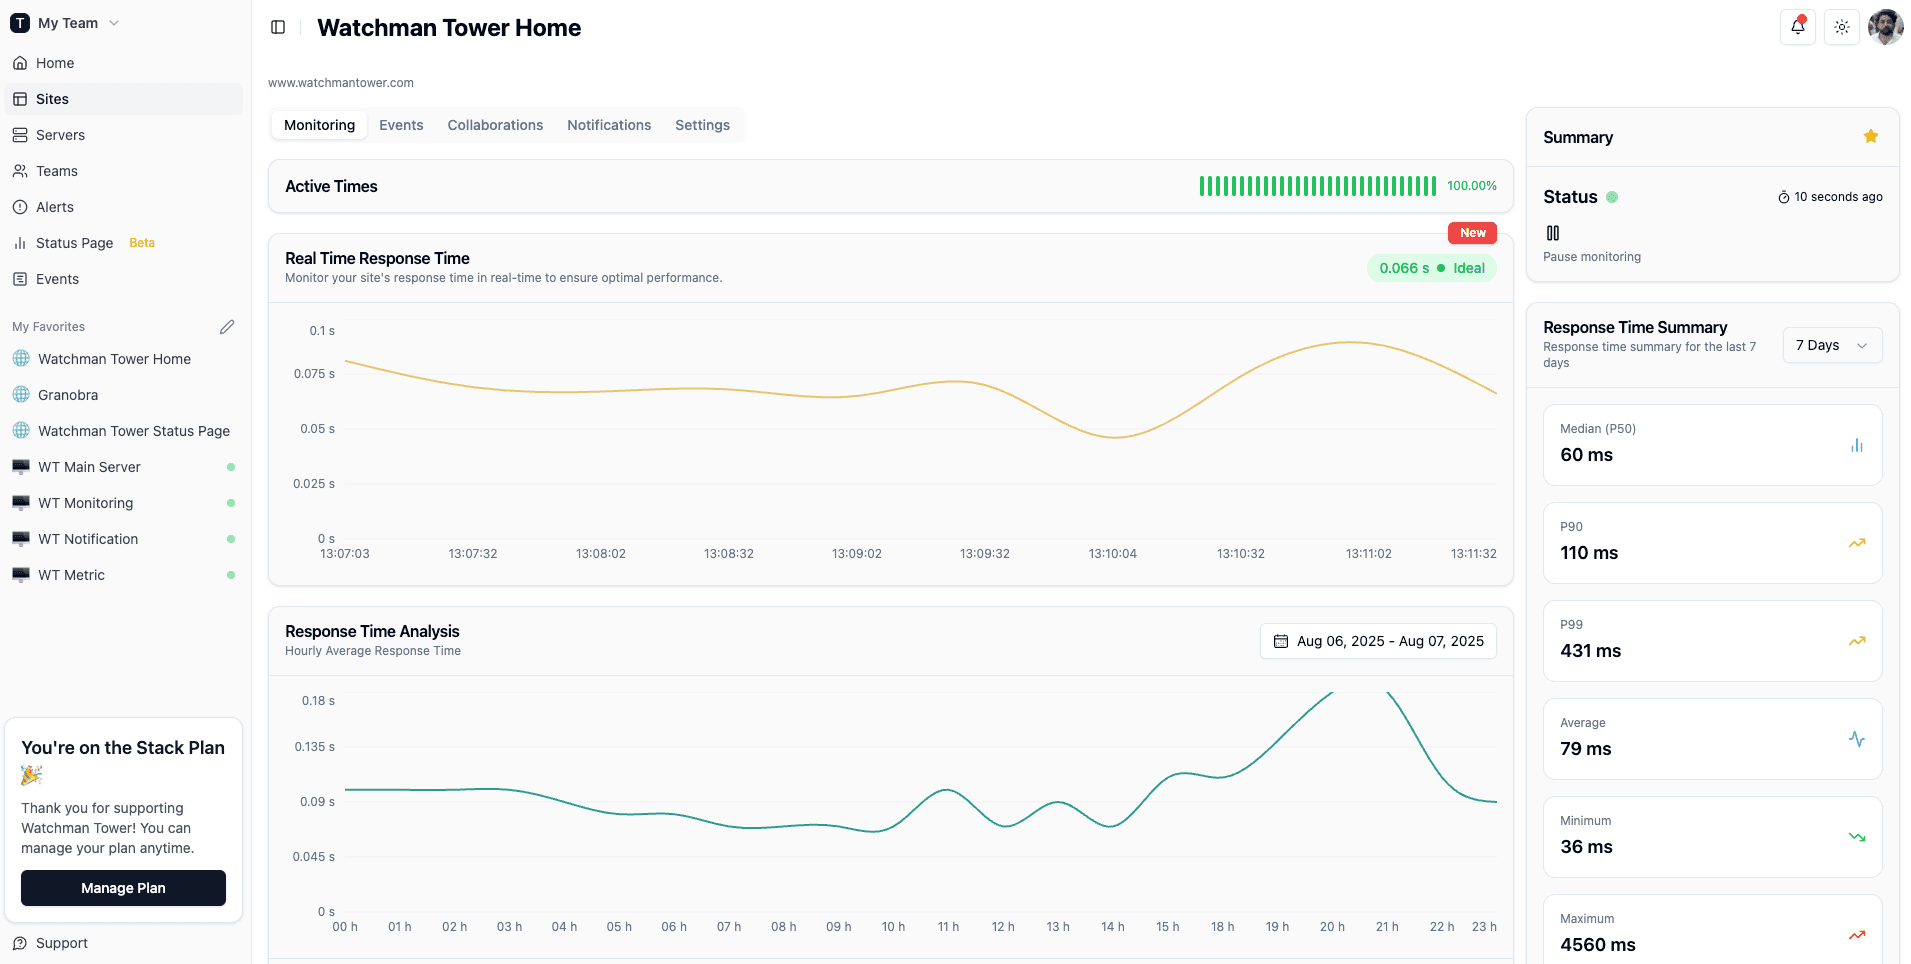
Check your website's health in seconds
Uptime · Response time · SSL · Domain expiry · WordPress detection
Response Time (ms)
RealtimeUptime
Incidents
- 08:32 • Response time
- 09:04 • Resolved
Noema decides what is a real incident
Noema is the health engine behind Watchman Tower. It turns every check on your websites and WordPress sites into signals, weighs them, and opens an incident only when the evidence supports it.
Confirmed, not assumed
A single failed check does not open an incident. Unclear failures need evidence from more than one region before you are alerted.
Names the problem
Each incident says what is wrong, such as a partial outage, slow responses or a WordPress backend failure, and states its primary cause.
Quiet when it should be
Brief blips and sites that flap up and down do not turn into a stream of alerts.
Everything You Need to Catch Problems Early
From uptime checks to incident alerts, every feature below works together to keep your team ahead of outages instead of reacting to them.
Multi-Region Checks
Watchman Tower checks every monitor from 3 regions on every plan, including Free. A failure seen from one location is compared with the others, which separates local network noise from real availability problems.
Instant Downtime Alerts
Watchman Tower detects website downtime from three regions, confirms real outages, and sends downtime alerts by email and push on every plan, with Slack and SMS on Team and Stack.
Uptime Monitoring
Reliable uptime checks, response time tracking, and alerting that help teams detect real incidents earlier and connect availability to broader health visibility.
WordPress Monitoring
Watchman Tower combines external WordPress monitoring with optional internal health signals. Track uptime, response time, SSL certificates, domain expiry, updates, memory usage, database status, cron activity, and other diagnostic context from one dashboard.
Server Monitoring
Go beyond basic CPU and memory charts. Watchman Tower helps you monitor server health with host metrics, process visibility, service status, port checks, and runtime signals from components like Nginx, Docker, MongoDB, and Redis.
Status Page
Status pages help teams turn monitoring into communication. Watchman Tower makes it easier to share uptime, incidents, and recovery progress with the people who need clear answers.
Managing WordPress sites for clients? The plugin adds updates, PHP memory, database and cron health to the same view.
WordPress monitoring for agencies →Built for Real Monitoring Workflows
Connect the Signals That Keep Systems Healthy
Website checks, server agents, WordPress monitoring, and alert channels all feed into the same view — so nothing falls through the cracks between tools.


External Visibility Without Extra Friction.
Monitor website availability, response time, SSL status, and domain health from one place so problems are visible early.
Start with clear external checks, then layer in alerts, incident visibility, and broader health context as operational needs grow.
Explore Uptime MonitoringServer Agent Signals in the Same Health View
Track server telemetry like CPU, memory, disk usage, network transfer, uptime, load averages, and top process behavior alongside the rest of your monitored assets.
Bring lightweight server-side signals into the same operational view so teams can respond with more context instead of isolated metrics.
Explore Server MonitoringShared Health Visibility for Teams
Work from shared dashboards, role-based access, alerts, status communication, and reports instead of scattered monitoring tools.
Keep the right people informed with a platform built for monitoring, operational visibility, and coordinated response.
Alerts Delivered Where Your Team Already Works.
Watchman Tower sends alerts by email, mobile push, Slack, and SMS, so your team hears about issues the moment they happen.
Simple Plans That Scale With Your Team
Choose a plan by how many websites and servers you need to monitor. Every plan checks from 3 regions and includes the WordPress plugin.
- 10 Websites
- 3 Monitoring Regions
- 5-Minute Monitoring Interval
- Email & Push Alerts
- WordPress Plugin Included
- Weekly Uptime Report
- 50 Websites
- 1 Server
- 3 Monitoring Regions
- 1-Minute Monitoring Interval
- Email & Push Alerts
- WordPress Plugin Included
- Weekly Uptime Report
- 100 Websites
- 5 Servers
- 3 Monitoring Regions
- 1-Minute Monitoring Interval
- All Alert Channels
- WordPress Plugin Included
- Team Collaboration
- 500 Websites
- 50 Servers
- 3 Monitoring Regions
- 30-Second Monitoring Interval
- All Alert Channels
- WordPress Plugin Included
- Priority Support
Latest Insights and Updates
Practical guides on uptime monitoring, incident response, and keeping your infrastructure healthy — from the team building Watchman Tower.
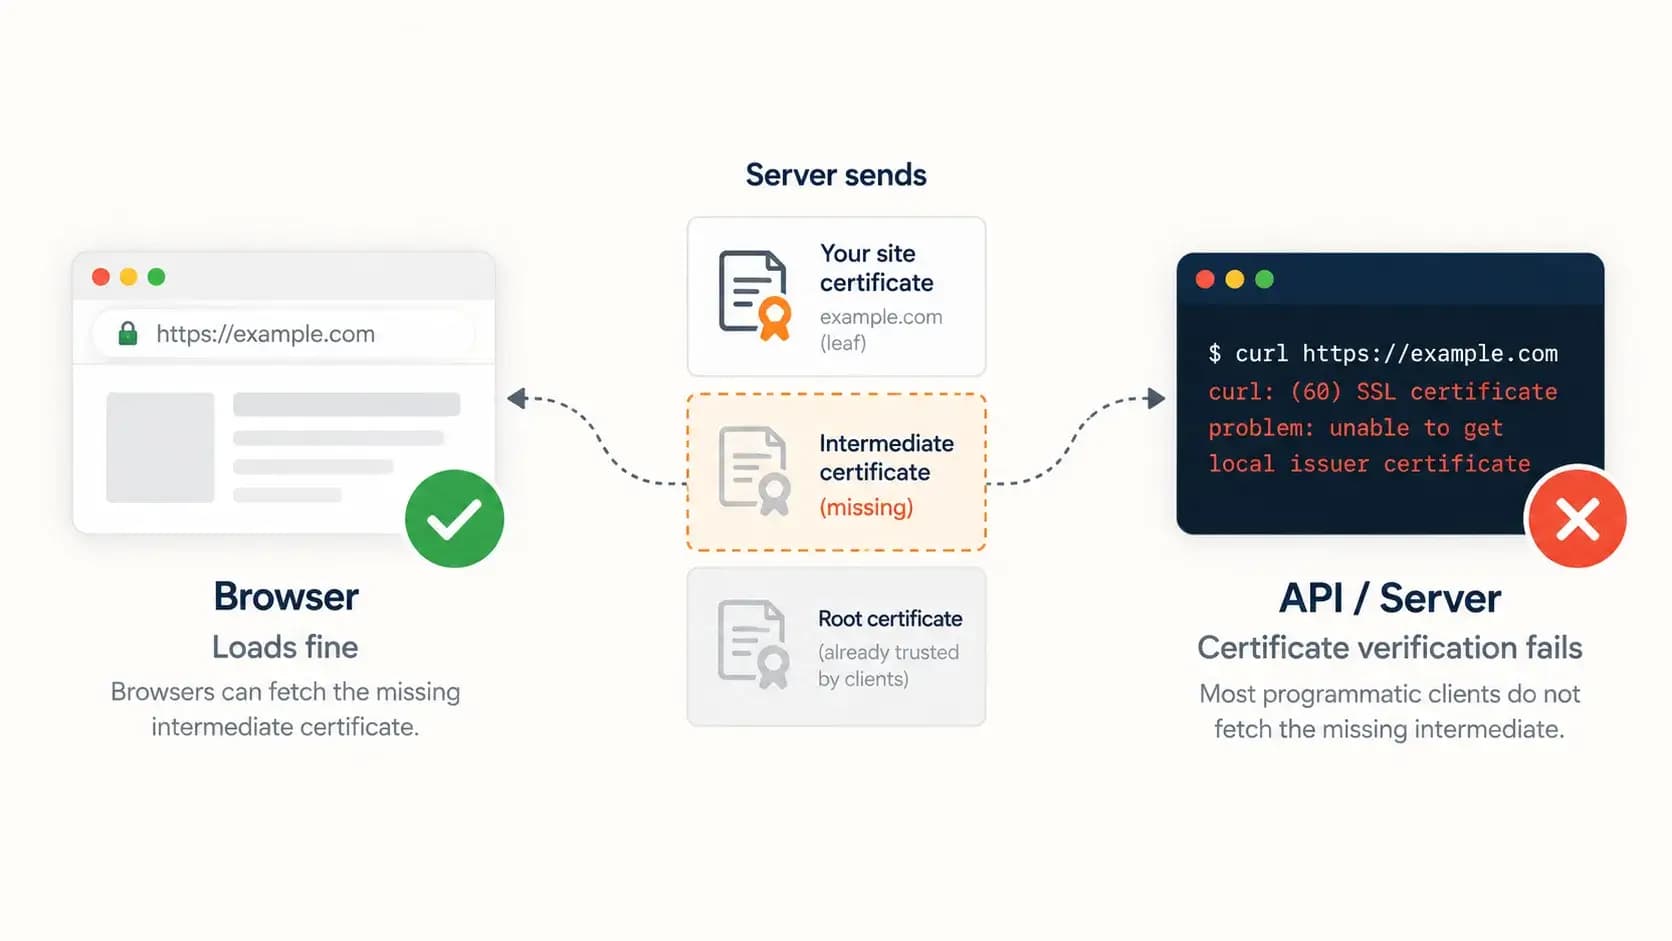
Unable to Verify the First Certificate: Why Your Site Works in Chrome but Fails for APIs
Your site opens fine in Chrome, but curl, Node.js and webhooks fail with "unable to verify the first certificate". The cause is usually a missing intermediate certificate. Here is how to confirm it and fix it on the server.
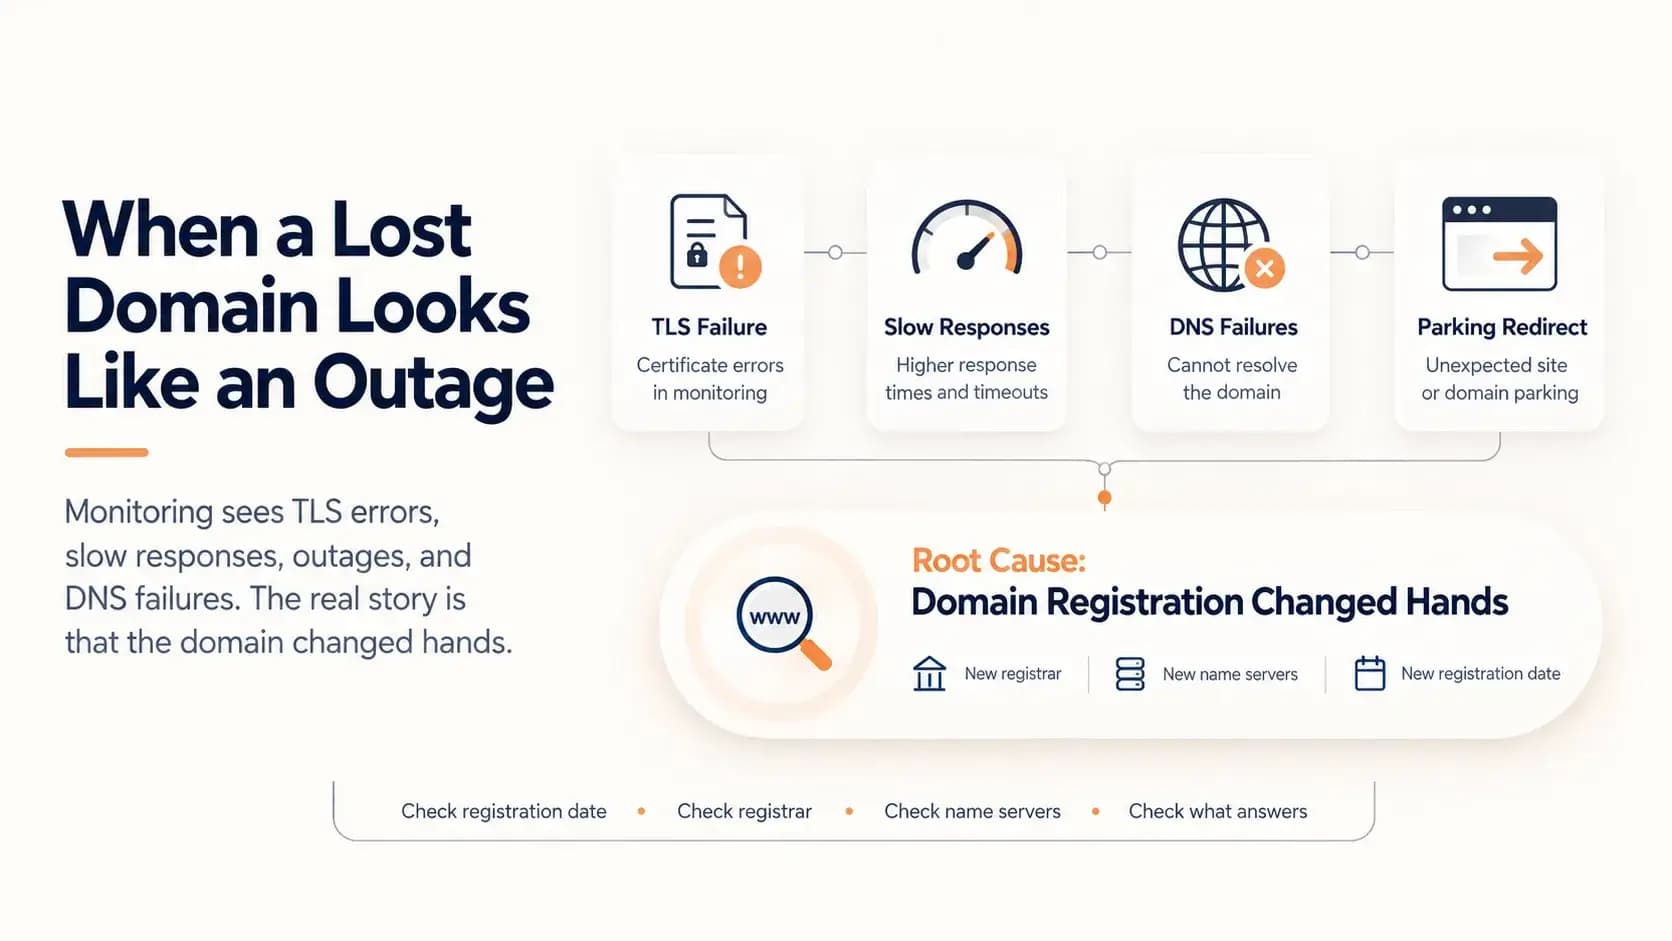
What Happens When a Domain Expires and Someone Else Registers It
A domain that lapses and is registered by someone else does not look like a lost domain. It looks like a certificate error, slow responses, an outage and DNS failures. This case follows one such domain through five weeks of accurate but misleading alerts, and shows how to tell the difference.
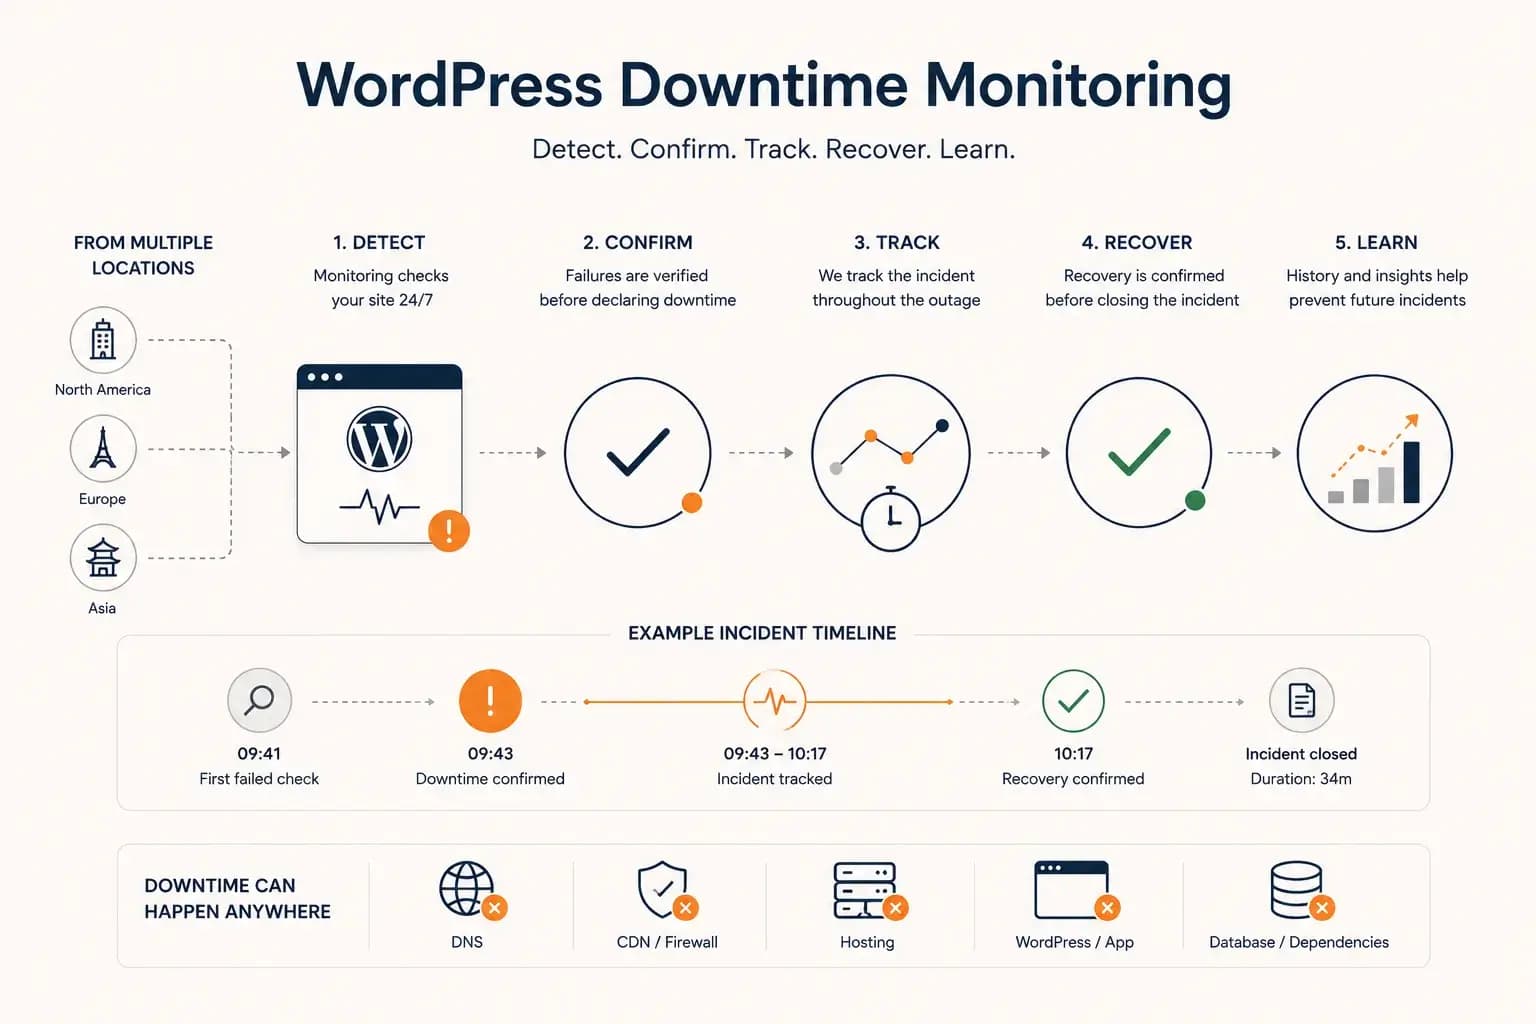
WordPress Downtime Monitoring: How to Detect and Track Outages
WordPress downtime monitoring goes beyond detecting a failed request. Learn how to confirm real outages, track incidents, verify recovery, and use downtime history to improve reliability.
Start Monitoring in Seconds.
No credit card required. Sign up and add your first site in seconds — see your first health check today.